Business Intelligence Projects

IPL Data Analysis & Visualization (2008-2017)
This project visualizes 10 years of IPL data to reveal winning strategies, player brilliance, and venue impacts. Through interactive dashboards, we decoded how toss decisions, home advantage, and player form shape match outcomes—helping teams and analysts make data-driven decisions. Explore the Tableau workbook to dive deeper into cricket's most thrilling league!
Tableau
Data Visualization
Sports Analytics
Dashboard Design
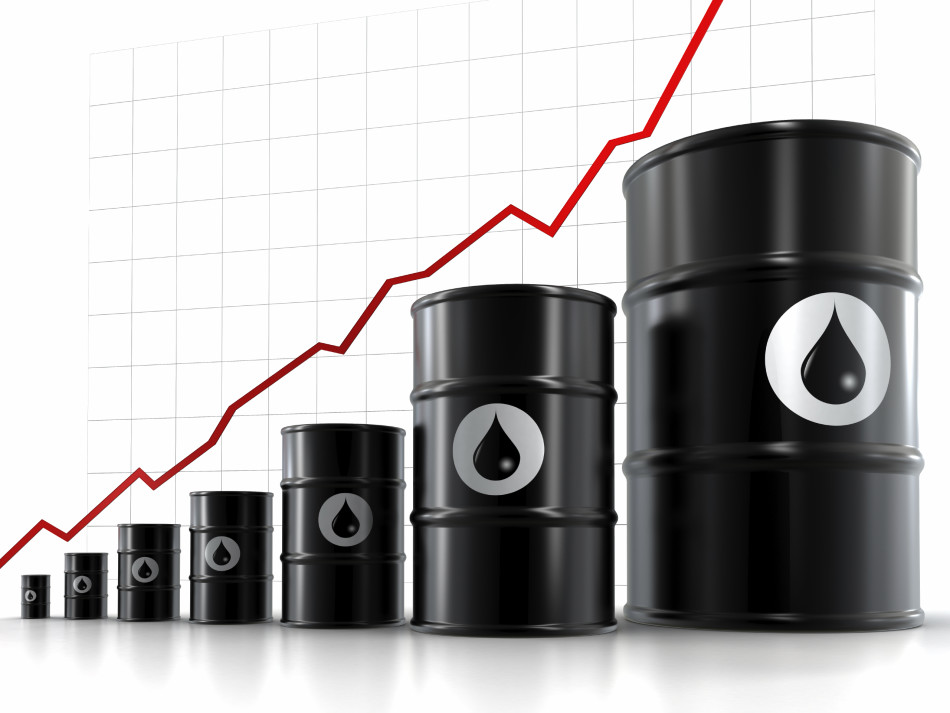
Fuel Price Trends Analysis in Argentina (2016-2023)
This Power BI project decodes Argentina's fuel pricing trends, uncovering regional inefficiencies, seasonal spikes, and cost-saving opportunities. From truckers to policymakers, these insights empower stakeholders to navigate the fuel market strategically. Dive into the interactive dashboard to explore the data!
Power BI
Time Series Analysis
Economic Analysis
Interactive Dashboards